
What is Ketamine ?
Ketamine is a Food and Drug Administration (FDA) Schedule III medication (the same class as Tylenol with codeine). It is considered a “dissociative anesthetic.” This means that with high doses of ketamine the brain is temporarily less aware of the senses, causing a state of dissociation between the mind and the body. Ketamine has been frequently used in emergency medicine, procedural medicine, anesthesia, critical care medicine, battlefield medicine and in general hospital medicine since 1970. It is considered a safe medicine with few side effects. In fact, it is so safe and effective that it is listed on the World Health Organization’s (WHO) Essential Medicines List (EML) for all health care systems.
Since the late 1990’s, clinical use and research has shown that ketamine is a safe, rapid, and effective therapy for depression, PTSD, anxiety, substance use disorders and pain disorders among others. The use of ketamine for these conditions is considered “off-label” meaning that it is not officially sanctioned by the FDA, but that it is allowed. To be clear, there are many studies indicating the safety and efficacy of ketamine as treatment for these conditions. In fact, the FDA has recently approved a patented nasal spray form of ketamine for some types of depression.
How is Ketamine given ?
Ketamine can be delivered to the body in many ways. In the hospital it is common to give ketamine directly into the vein through a tiny catheter (called an IV or intravenous catheter) that is inserted with a needle. There are clinics that deliver ketamine this way for depression, anxiety and other indications. This method of delivery requires a medicalized setting with continuous vital sign monitoring, medication pumps, an IV to be placed, and tubing to be present throughout the procedure.
Ketamine can also be delivered with an injection into the shoulder muscle, called an intramuscular injection (IM). Delivered this way, the body absorbs 93% of the ketamine compared to when it is done through an IV. The advantage is that there is no need for an IV, pumps, or continuous vital sign monitoring so the setting can be more therapeutic.
Additionally, ketamine can be delivered through the mucous membranes, most commonly the mouth and the nose (and less frequently the rectum or vagina). When given this way, the body absorbs about 25-30% of the medicine compared to when it is delivered through the IV. This means that a higher dose is given for similar effect.
At Horizon Healing, we provide ketamine by mouth with a rapid dissolving tab (RDT) or dissolving strip and by injection with a tiny needle in the muscle (intramuscular (IM)). We provide the medicine this way to allow for a healing setting rather than a medicalized setting. Each method of delivery has its own character in terms of rapidity of onset, depth of experience and duration of experience. We find the by mouth and IM methods to be the most conducive to promoting a transformational experience.
How Does Ketamine Work?
This drawing illustrates how ketamine works on some brain cells. On the far left, ketamine turns off the cell that acts like a brake (brown cell) for the other 2 cells (green and blue cells). When this brake is turned off, the other brain cells are free to release chemical signals that promote brain cell growth and connection, known as neuroplasticity.
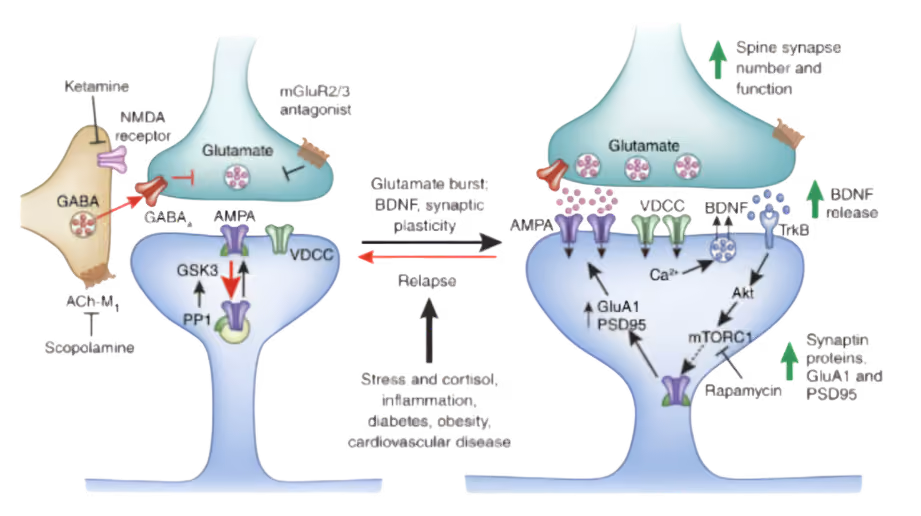

Signals between brain cells are transmitted by chemicals and electrical currents that cause many complicated negative and positive feedback loops. The human brain is very complicated, our knowledge of what goes on is somewhat superficial and just beginning to become sophisticated. At this point, we can only scratch the surface of the complexities of the effects of any particular substance on the brain’s activity, much less begin to formulate theories on the interactions between brain and consciousness.
However, it appears that ketamine affects communication and signaling between brain cells. Ketamine acts upon many different receptors in the brain, but its main effect is as an NMDA-receptor antagonist. This means that it blocks a particular type of receptor, the N-methyl-D-aspartate (NMDA) receptor, on certain brain cells. One way ketamine seems to work is that it stops a type of brain cell whose job is to stop the activity of a different type of brain cell. Basically it takes the foot off the brakes, and allows some specific brain cells to be more active.

On the left is an example of the dendrites from a normal brain cell. The dendrites are like roots that connect the brain cell to other brain cells. The middle illustration shows how the dendrites become “pruned” in a cell from a brain that has been exposed to chronic stress. The illustration on the right shows how those dendrites regrow just 1 day after ketamine treatment.
This increased activity can bring about new connections and interactions between different areas of the brain. For example, it seems that ketamine turns down activity in what has been called the default mode network while at the same time promoting new connections in other regions of the brain. These effects likely explain some of the changes in consciousness in the minutes, hours, and days after administration of ketamine. There is evidence that ketamine actually stimulates the growth of brain cells and strengthens and creates new connections between brain cells. In this way, it seems that ketamine can enhance neuroplasticity, or the ability for the brain to change its connections and even structure.
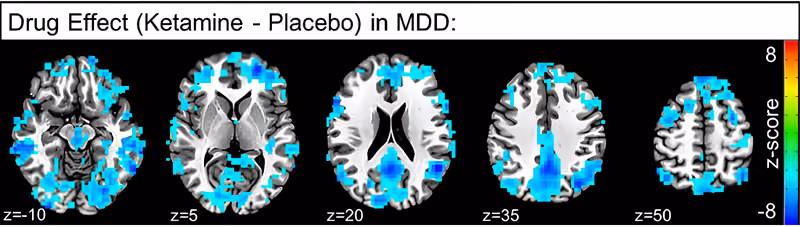
This is an illustration of how ketamine actually changes the network connections in the brain. The illustration compares the brains of people suffering from depression who received ketamine with those who received a placebo. The blue dots are areas of the brain that are less active in those receiving the ketamine than those receiving the placebo. Interestingly, many of these areas are part of the default mode network.
What is Ketamine Assisted Therapy (KAT)?
When a ketamine session is preceded by intentional preparation, conducted in a safe, compassionate and therapeutic setting and followed by deliberate integration, we call this ketamine assisted therapy (KAT).
The KAT experience can provide a respite from habitual patterns of thought and allow compassionate awareness of challenging emotions, beliefs and memories.
Working together in this spacious awareness, we can gain new perspectives and achieve deep and durable therapeutic break-throughs.Paramount to KAT is the creation of a safe and trusting “container” or setting in which the experience unfolds. We find that intentional preparation in the context of a trusting and safe container most frequently brings about transformational experiences.
As such, we prioritize creating a supportive, trusting, safe, and collaborative partnership with each client. During each KAT session, our physician and therapist will work together to create a supportive, comfortable and healing space.
What will I feel during a ketamine session?
Every person will experience ketamine in a unique way. In fact, every session for every person will be experienced in a unique way. For the vast majority of people, the vast majority of the time, the KAT experience is described as profoundly meaningful and positive. A small percentage of the time, the experience is described as neutral, disappointing, or uninteresting. While an even smaller portion of people described their experience as unpleasant. We believe there is no negative experience, that every experience is equally valuable when properly integrated.
In the doses we use for KAT, your so-called “ordinary state of consciousness” is altered and a “non-ordinary state of consciousness” (NOSC) may be experienced. For the vast majority of these experiences, the body is light and deeply relaxed and the NOSC is associated with a deep sense of calm and curious receptivity. Some people can have an experience of deeply felt or even euphoric empathy, compassion and open-heartedness. Some may experience synesthesia, a mingling of the senses (such as “seeing” or “smelling” sound). Some may have an out of body experience or experience a loss of identity. Some may have what is termed a mystical experience touching a deeper universal reality or collective unconscious. Some may have what may initially seem like an unremarkable or underwhelming experience.
The importance of integrating the lessons of these experiences, be it a “peak” mystical experience or a seemingly unremarkable experience, into everyday life is where we believe the transformative power of KAT resides. Being able to re-organize habitual thoughts and behavioral patterns in the light of a profound new experience takes support and intentional mindfulness. For this reason, we provide specialized integrative supportive therapy after your KAT sessions.
For what conditions does ketamine help?
Research supports ketamine assisted therapy for a variety of mental and physical conditions:
- Depression
- Post-traumatic stress disorder (PTSD)
- Anxiety-Substance use disorders
- Eating disorders
- Headaches - migraines
- Pain disorders
- Palliative and end-of-life care
